Emerging market economies have accelerated strongly from their cyclical trough in mid-2023. Normally, such a rise would be greeted with enthusiasm and much discussion amongst financial market participants. ‘’Reflation” not “recession” would be the word on most investors’ lips.
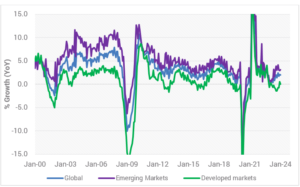
In fact, the recovery in Emerging Market (EM) production growth has been so strong that it has pulled global production from stall speed in early 2023 to a respectable 2%yoy growth by the start of 2024. This is despite Developed Markets (DM) industrial production remaining in contraction mode.
Financial markets have been very slow to notice this development, which is of course since the equity market capitalisation of DM, as defined by MSCI, is currently around 7.6-times the size of the EM. Similarly, DM debt markets are around 4-times the size of EM debt markets. All of this is despite the fact that EMs represent 58% of global GDP and a massive 86% of global population.
Put simply, financial markets only tend to believe in an economic recovery when there is evidence that it is occurring in the West.
However, there are good reasons not to discount the recovery in EM growth.
The first is that this is typically what happens. EM led DM industrial production growth out of the 2001 global recession, they led DM out of the global financial crisis, and they even led DM into the upswing that is frequently attributed to Trump’s 2016 election win. The most likely reason is that most of EM are either commodity exporters or manufacturing focused economies servicing global markets. They are at the pointy end of any shift in global liquidity and forward orders.
We shouldn’t be surprised that EMs lead nor should we discount the signal that it sends for a DM economic recovery this year. Indeed, as Chart 1 shows, EM industrial production growth troughed in early 2023 and, after almost 10 months of acceleration, DM industrial production growth is only just turning positive.
Chart 1: Developed Markets industrial production growth only now turning positive
Source: YCM, Feb 2024.
But there are three other reasons why we shouldn’t discount the signal from EM growth this cycle which are different this time around.
1. The typical catalysts for an EM crisis failed to generate a material economic shock
Which ones? Namely: a US$ spike, higher global interest rates, and weak global demand.
A surging US$ – the US Trade Weighted Index (TWI) rose 27% over the 18 months to September 2022 and remains around 20% above the level that persisted from 2005-2015 – normally creates significant liquidity squeezes for typically US$ funded emerging market debt. Yet there have been few signs of material trouble digesting the US$ move.
Similarly, policymakers have raised rates by about 400 basis points on average in advanced economies since late 2021, and around 650 basis points in EM economies. Again, such a move would typically be a catalyst for distress, yet there have been few reports indicating trouble servicing the debt, even as sales slowed. The reason for the resilience is partly because EM countries have generally become more sophisticated and improved their treasury risk management in particular, combined with relatively low levels of debt due maturing in 2023 and 2024. In many ways the lack of an EM crisis this economic cycle is one of the more remarkable – yet rarely talked about – developments over the past two years.
While the lack of a crisis is undoubtedly a positive, the catalyst for improved industrial demand though EM can most likely be attributed to two new exogenous sources of global demand (read on!) that lean heavily on emerging market production.
2. EM Supply chain duplication has acted as a growth catalyst
The spike in geopolitical tension between Western nations and China has driven Western companies to seek to diversify supply chains from China. Indeed, China’s trade share with the US has fallen sharply in the intervening period.
India, Vietnam and Mexico are the main beneficiaries of this investment, albeit there is evidence that China entities have themselves relocated and rebuilt manufacturing and distribution channels in these countries.
This duplication of supply lines is both resource intensive and inflationary in the first instance, with second round growth benefits accumulating subsequently.
3. The capital spend required for decarbonisation has been a boon for EM
This is perhaps the most under recognised driver of the EM recovery. While it’s easy to dismiss the capital spending as merely incremental spend, McKinsey estimates that the required increase in annual investment spending is approximately US$3.5 trillion per year, roughly 60% more than is being spent today. McKinsey further estimates that this incremental spend will represent approximately 2.8% of global GDP between 2020 and 2050.
While there is a tendency to assume this spending is concentrated in the developed world, many EM countries are rich in the mineral resources essential for the energy transition. Under McKinsey’s estimates of that US$3.5 trillion of additional capital spend required annually for the energy transition, US$2 trillion p.a. is required in EMs. That is, close to 60% of this massive investment is directly required in EMs, and EMs will also benefit indirectly from the capital goods and inputs required for the remaining US$1.5 trillion p.a. investment required in DMs.
While investors are naturally cautious over mainland China’s prospects, in our view, we should be careful not to discount the rest of EM and the role they are providing in supporting and sustaining a global recovery in demand. In our view, they are better run, will continue to benefit from rising new orders in the West and they are enjoying some additional catalysts unique to this cycle via supply chain diversification and decarbonisation.
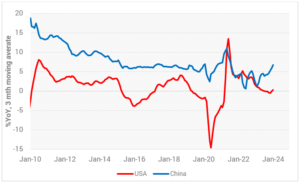
Importantly, we believe Australia will continue to benefit from improving EM demand growth regardless of a major stimulus package delivered by China. In many ways that is the point: the recovery in EM occurred in spite of China, not because of it. Yet China is now belatedly joining the fray; China’s industrial production is currently expanding at a 6.8%yoy rate, up from a 1.3%yoy rate of growth in early 2023 and above the 6.2% average pace recorded in the five years before COVID (refer Chart 2). Yet market sentiment continues to struggle even as actual economic activity recovers.
Chart 2: USA and China industrial production growth provide an interesting contrast
Source: YCM, Feb 2024.
Why is all of this important for investors?
Our view has long been that the global cycle would reach its trough around mid-2023 and a broader recovery would be evident by late-2023. From the evolution of the data over recent months this seems no longer even up for debate. Non-China EMs have already recovered and China’s own recovery in activity seems somewhat underappreciated by financial markets. With surveys of new orders in the West suggesting DM industrial activity is poised to commence its own cyclical upswing, we expect that a more durable and broad-based global industrial upswing will soon be evident.
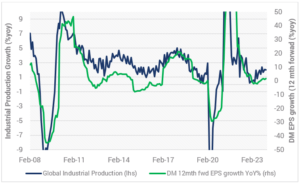
Investors could well look at the stronger-than-market-expected outcomes from the US and Australian reporting seasons and wonder if this merely reflects lags and whether a broader slowdown still lies ahead. However, if we are right and a more synchronised recovery is evident in the coming months then earnings will not just remain resilient, developed markets will move into upgrade-mode for earnings (refer Chart 3).
Chart 3: Global industrial production and DM EPS growth
Source: YCM, Feb 2024.
If global equities are to continue to climb the wall of worry – and, more importantly, for market leadership to broaden beyond US mega-Tech – then evidence of stronger earnings momentum across a wider range of industries is needed. The good news is that the nascent recovery in DM industrial growth has moved into the slipstream of the earlier EM recovery. We believe this provides solid footings for a global industrial growth upswing to drive higher and more diverse sources of earnings growth in major developed markets.
Developed market equities have risen 3% so far this calendar year, making good progress towards our 10% target for 2024. While there will be inevitable market pullbacks as the year progresses, the strongest driver of global equity returns in 2024 will be the trend improvement in the industrial cycle, and in this regard, EM is providing the light on the hill.


0 Comments